
The average Milton Keynes home reached £330,419 in July, the highest since the index began in 2009 and up £8,438 in a year. Flats were the only type to fall.
The average home in Milton Keynes was worth £330,419 in July 2026. That is the highest figure the UK House Price Index has ever recorded for the city, and it is a complete reversal of where the market was a month earlier.
The number comes from HM Land Registry’s UK House Price Index for Milton Keynes, July being the most recent month published. Prices are up 2.6% on July 2025, when the average was £321,981. In cash that is £8,438 in twelve months.
Why this one is a record
The index holds monthly figures for Milton Keynes back to December 2009, 200 months in all. July 2026 is the highest of the lot. The previous peak was £327,787 in April 2025, so the city is now £2,632 above its old high.
It arrives from nowhere. In June the average was £325,165 and the annual change was minus 0.1%, which made Milton Keynes the only area in its group where homes were worth less than a year before. We reported that in August. One month later the annual change is plus 2.6%, and the month-on-month rise of 1.6% is the biggest of any area we compare the city with.
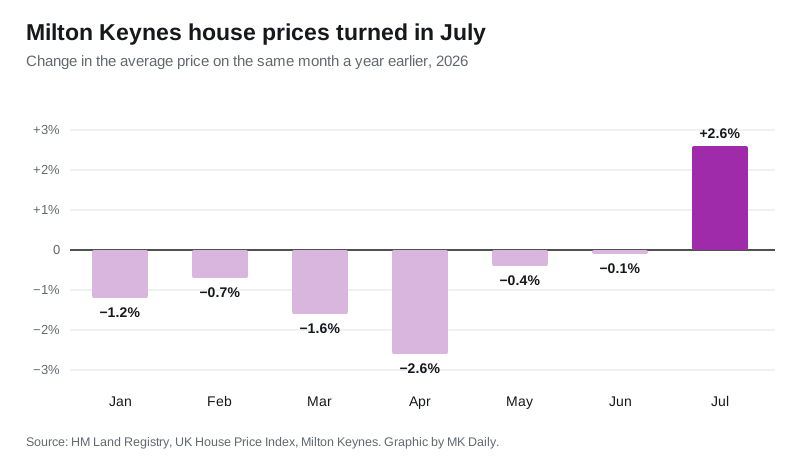
The annual change ran minus 1.2% in January, minus 0.7% in February, minus 1.6% in March, minus 2.6% in April, minus 0.4% in May and minus 0.1% in June before July’s plus 2.6%.
How the neighbours did
Milton Keynes has gone from bottom of this group to second.
| Area | Average price | Year | Month |
|---|---|---|---|
| Buckinghamshire | £479,736 | +1.1% | −2.0% |
| Central Bedfordshire | £356,758 | +1.2% | +0.6% |
| Bedford | £333,824 | +3.9% | +0.8% |
| Milton Keynes | £330,419 | +2.6% | +1.6% |
| West Northamptonshire | £291,929 | +1.2% | +0.2% |
| South East | £380,878 | +0.2% | +0.5% |
| England | £293,479 | +1.1% | +0.7% |
| United Kingdom | £272,611 | +1.4% | +0.7% |
Only Bedford grew faster over the year, at 3.9%, and Bedford is still the dearer of the two by £3,405. The eye-catcher is Buckinghamshire. The county average fell £9,997 in a single month, from £489,733 to £479,736, and its annual growth dropped from 4.1% in June to 1.1% in July. The gap between Milton Keynes and the county next door narrowed from about £164,600 to about £149,300 in one month.
Semis up 4%, flats still falling
The city average hides four different markets.
- Semi-detached: £334,664, up 4.0%, the strongest type
- Terraced: £276,767, up 3.5%
- Detached: £559,242, up 2.3%
- Flats and maisonettes: £167,700, down 0.4%
Flats are the only type in Milton Keynes worth less than a year ago, and they have been the weak segment all year. That matters here more than in most places because the city has a large flat stock concentrated in and around the centre.
The index also splits by buyer. A first-time buyer paid an average of £276,504, up 2.8%. Someone who already owned and was moving paid £403,797, up 2.5%.
Three things to hold against the headline
It is a mean, not a median. UKHPI averages every recorded sale, so a handful of expensive completions pull it up. Our own postcode-by-postcode median, worked from Land Registry sale records, is the better guide to what a normal home fetches in your part of the city.
Almost nobody is moving. Sales volumes are only published up to May 2026, and that month recorded 199 sales across the whole of Milton Keynes. January to May 2026 came to 1,116 sales against 1,603 in the same five months of 2025.
That comparison is worse than it looks, and also better. March 2025 alone was 551 sales, the stamp duty deadline pulling completions forward. Strip March out of both years and it is 853 sales this year against 1,052 last year, still down about a fifth. Volumes for recent months also rise as sales finish being registered, so May’s figure is a floor rather than a final count.
What it means for you
If you are selling, the market has turned, but on thin evidence. A record average built on 199 sales a month is not the same as a queue of buyers. Price against what has actually completed near you, not against the headline.
If you are buying, the cheap window has closed for now. The average is £5,254 higher than it was in June. Flats are the exception and are still drifting down.
If you own a flat, your value is the one part of the Milton Keynes market that has not recovered. At £167,700 the average flat here is worth less than it was a year ago and well under half the average detached house.
If you are staying put, the practical number is your council tax band rather than your value. Bands are still set on 1991 values and none of this changes them. Ours are listed at Milton Keynes council tax bands.
Corrections and revisions
The UK House Price Index revises earlier months as more sales are registered, and this release moved several figures we have published.
- We gave June’s Milton Keynes average as £325,104. It has been revised up to £325,165, a difference of £61.
- We gave the 2026 annual changes as minus 1.7% for March, minus 2.9% for April and minus 0.9% for May. They now read minus 1.6%, minus 2.6% and minus 0.4%.
- June figures for neighbours have also moved: Bedford from £329,830 to £331,319, Buckinghamshire from £490,508 to £489,733, Central Bedfordshire from £356,453 to £354,690, West Northamptonshire from £292,754 to £291,415, England from £293,262 to £291,581, the South East from £380,380 to £378,821 and the UK from £272,188 to £270,677.
Sources: UK House Price Index, Milton Keynes, July 2026 and the monthly series for Bedford, Buckinghamshire, Central Bedfordshire, West Northamptonshire, England, the South East and the United Kingdom, all published by HM Land Registry.
Have your say